In today's data-driven world, the ability to present complex information in a clear, visually appealing manner is invaluable. Infographic templates and slide designs have become essential tools for professionals across various industries.
In this article, we will explore what infographic templates are, their advantages, different types available, how to create them effectively, and how to utilize ilovefree.ai to enhance your infographic template creation process.
What is an Infographic Template?
An infographic template is a pre-designed framework that provides a structured layout for presenting information visually. It typically includes elements such as charts, graphs, icons, images, and text boxes arranged in a way that tells a compelling story with data.
These templates are designed to be customizable, allowing users to input their specific data while maintaining a professional and aesthetically pleasing design.
The Advantages of Using an Infographic Template
1. Time Efficiency: Infographic templates save time by providing ready-made layouts, eliminating the need to design from scratch.
2. Consistent Design: They ensure a uniform look and feel across all slides or pages, enhancing professionalism.
3. Visual Appeal: Well-designed templates make complex information more engaging and easier to understand.
4. Flexibility: Templates can be adapted to various topics and industries with minimal effort.
5. Collaboration: Standardized templates facilitate teamwork, as everyone works within the same design framework.
6. Brand Alignment: Customizable templates allow companies to incorporate their branding elements consistently.
Different Types of Infographic Templates
1. Statistical Infographics: Focus on presenting data through charts, graphs, and numbers. These templates are particularly useful for slide presentations where complex data needs to be simplified for better audience comprehension.
2. Process Infographics: Illustrate workflows or procedures step-by-step. They are ideal for educational or training slide decks where guiding the audience through a sequence of actions or stages is necessary.
3. Comparison Infographics: Highlight differences between products, services, or concepts. This type works well in slide presentations where decision-making or understanding distinctions is crucial for the audience.
4. Timeline Infographics: Show historical developments or project milestones chronologically. They add a dynamic element to infographic template slide presentations by providing a clear visual progression of events or plans.
5. Geographic Infographics: Display location-based data using maps. These are valuable in slide presentations where understanding spatial relationships or regional differences is important.
6. Hierarchical Infographics: Represent organizational structures or priority levels. They help in slide presentations where demonstrating relationships or authority levels within a company or project is needed.
7. Mixed-Content Infographics: Combine various elements to create comprehensive visual narratives. This type offers versatility in slide presentations by integrating diverse data types into a cohesive visual story.
How to Create an Infographic Template
1. Define Your Purpose: Determine the primary use of your template and the key messages you want to convey. This foundational step ensures that your infographic template is tailored to meet specific objectives, whether it's for educational purposes, marketing campaigns, or internal reports.
2. Research Visual Elements: Gather relevant icons, images, and color schemes that align with your topic. Collecting these elements beforehand ensures consistency and coherence in your design, making it easier to maintain a professional appearance throughout your slide.
3. Choose a Layout: Decide on the overall structure of your slide, considering how different elements will be positioned. A well-thought-out layout helps guide the viewer's eye through the information logically, enhancing comprehension and engagement.
4. Incorporate Data Visualization: Select appropriate charts and graphs to represent your information effectively. The right visualizations can transform complex data into easily digestible insights, making your slide more informative and compelling.
5. Add Text Elements: Include titles, subtitles, and description boxes with consistent formatting. Text elements provide essential context and explanations, ensuring that your audience understands the significance of the visual data presented.
6. Establish a Color Palette: Use colors strategically to enhance readability and visual hierarchy. A thoughtful color scheme not only makes your slide visually appealing but also helps emphasize important information and create a cohesive look.
7. Create a Prototype: Develop a rough version to test the flow and functionality of your design. Prototyping allows you to identify potential issues with layout, content placement, or visual balance before finalizing your template.
8. Refine and Finalize: Make adjustments based on feedback and ensure all elements work harmoniously. This final step involves polishing your design, checking for consistency, and making sure that your infographic template effectively communicates your intended message.
Utilizing ilovefree.ai to Create Your Infographic Template
ilovefree.ai offers a comprehensive suite of tools that can significantly enhance your infographic template creation process.
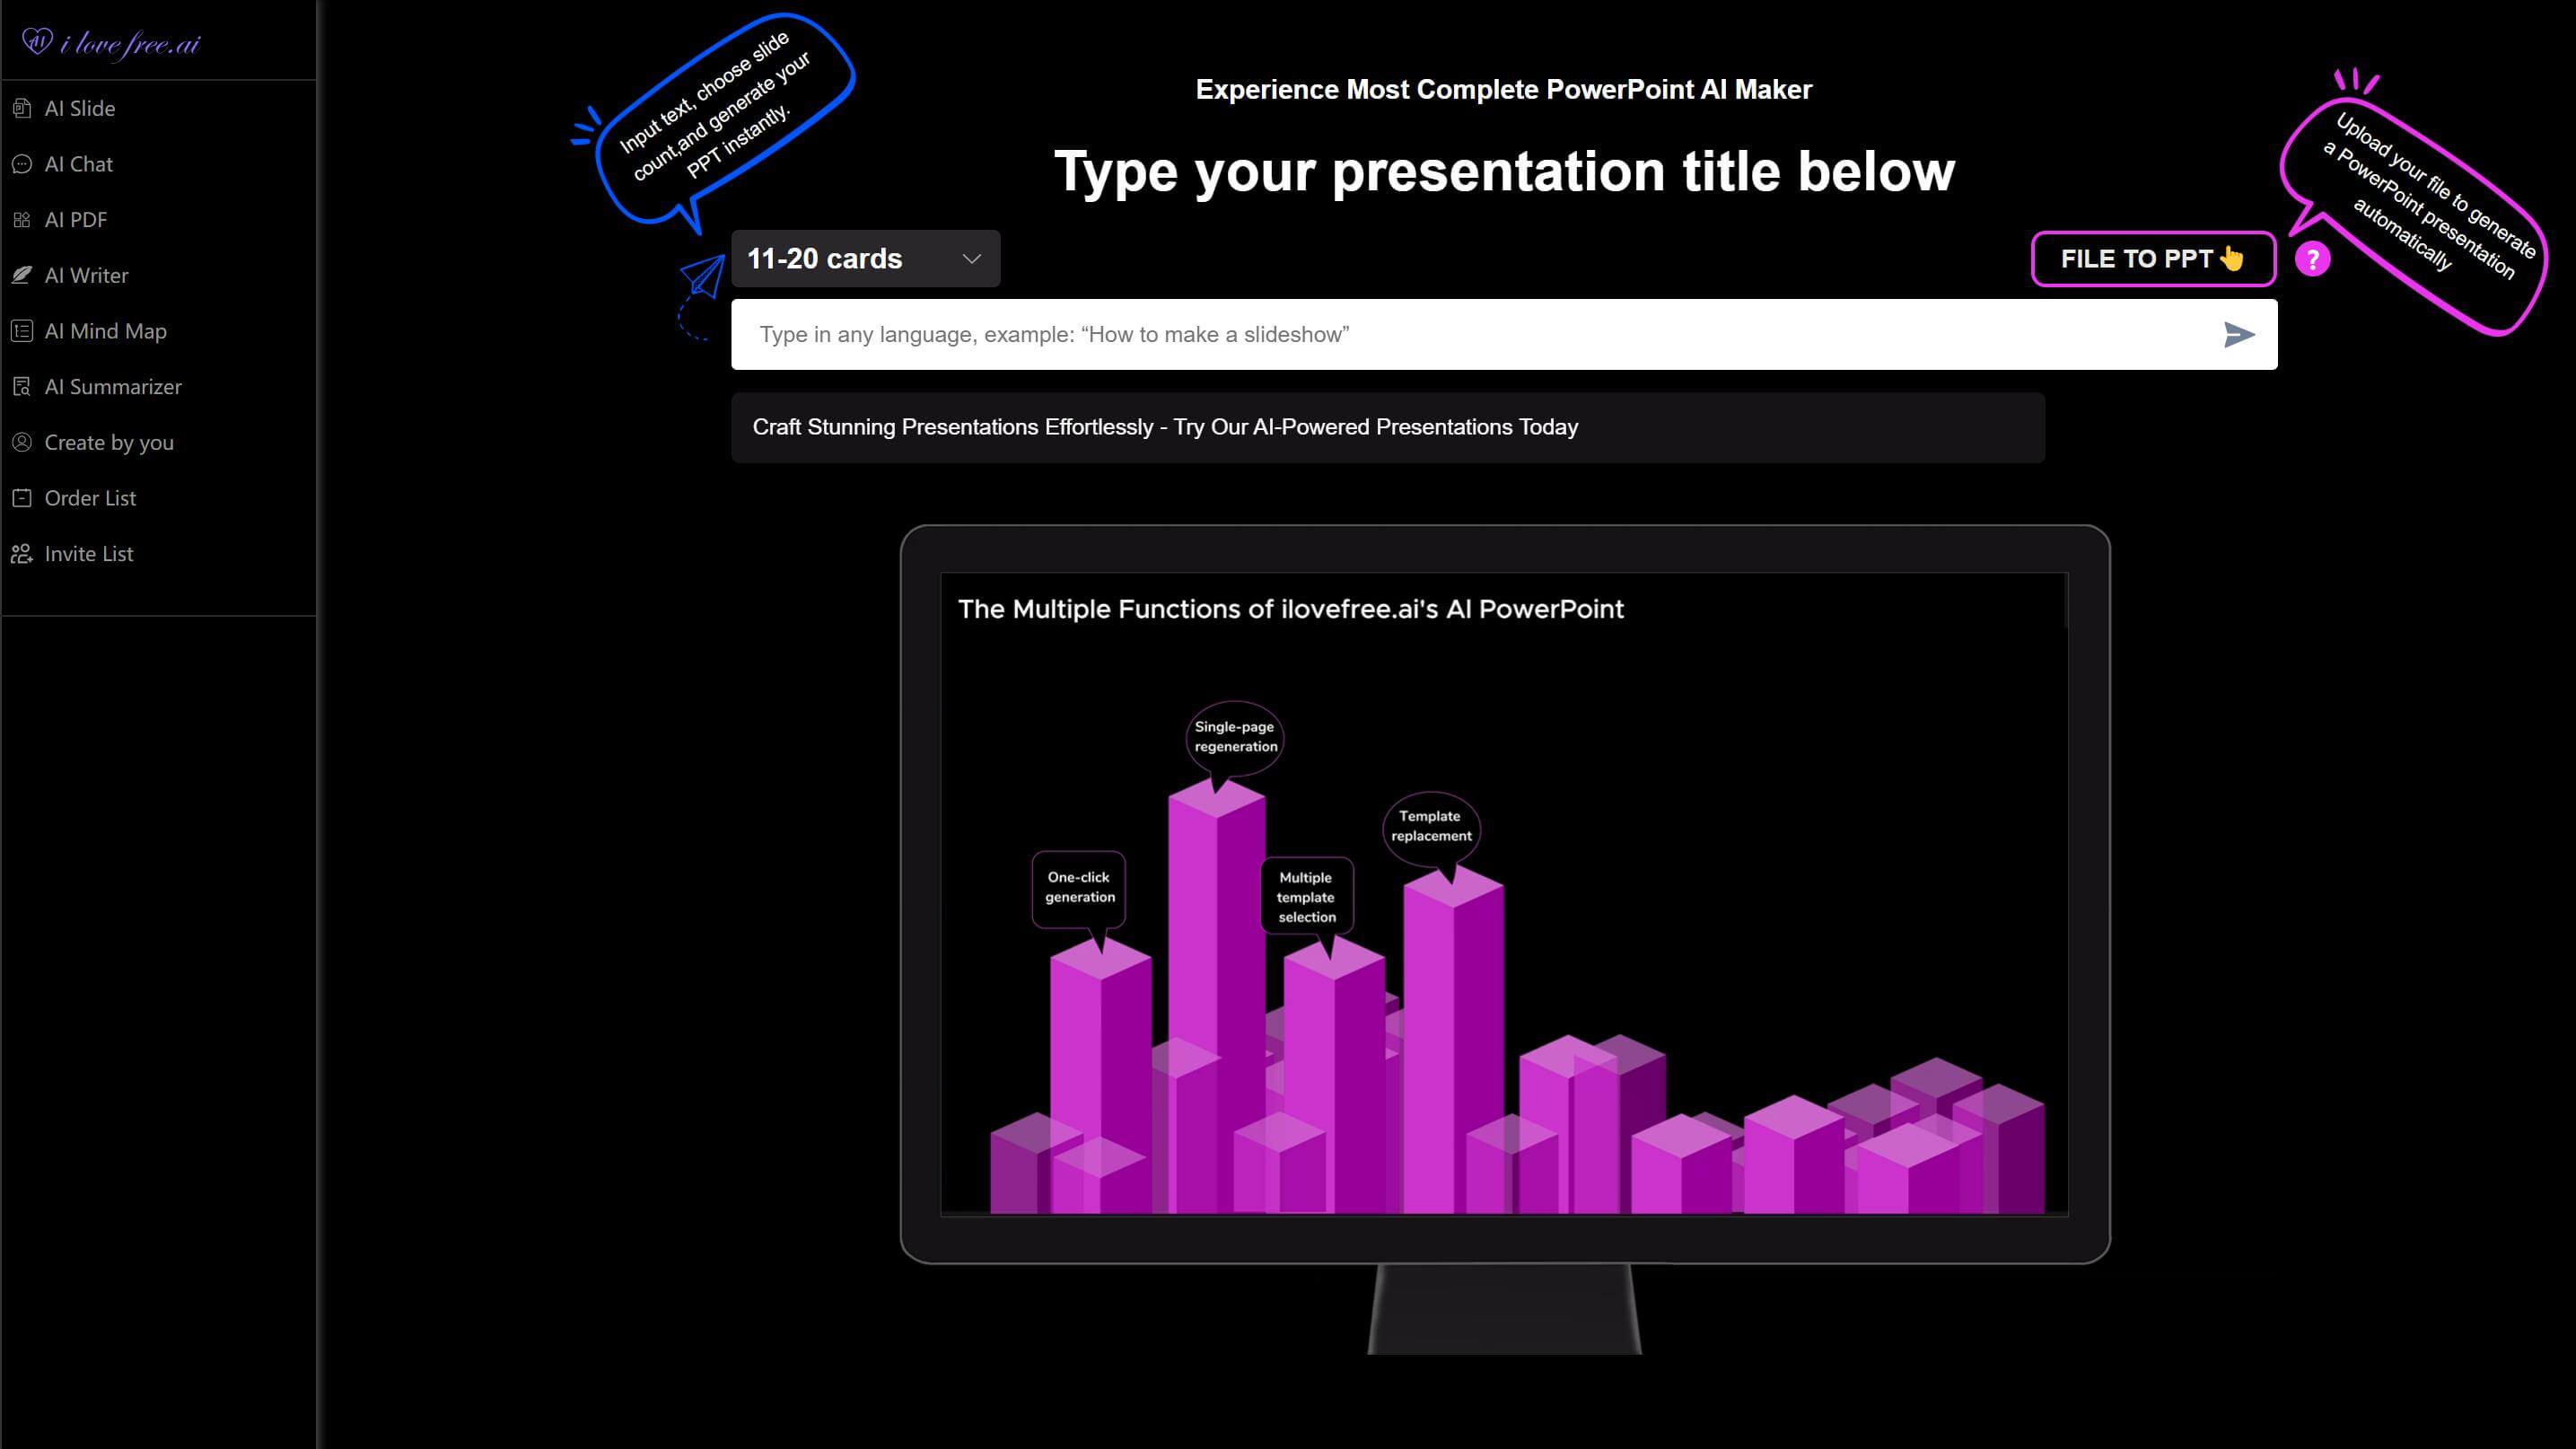
- The AI Slide feature allows you to generate professional slide outlines instantly by inputting keywords, saving you time in preparation. With its extensive template library, you can customize slides to perfectly match your infographic needs.
- The AI Chat functionality provides real-time assistance during the design process, helping you quickly access information, generate responses, or clarify complex points. This ensures your creative flow remains uninterrupted.
- For document-heavy projects, AI PDF tools streamline the handling of materials. You can easily split or merge PDF files, convert between formats, and add watermarks as needed.
- The AI Writer helps craft compelling narrative content that complements your visual elements, while the AI Mind Map tool can assist in organizing complex information before you even begin designing slides.
- the AI Summarizer is invaluable for post-presentation follow-up. By uploading meeting recordings, transcripts, or documents, you can generate concise summaries that capture the essence of discussions and decisions.
By implementing these strategies and leveraging tools like ilovefree.ai, you can create infographic templates that transform complex data into compelling visual stories, making your presentations more engaging and effective.

